


September 12, 2025 By Nick Forster
While markets initially spiked on the expected news of 2.9% U.S. CPI data, they quickly cooled before reverting to broader trends. Still, the print signals inflationary pressure may be creeping back in, particularly under the weight of new tariff regimes.
BTC and ETH both managed to push higher despite the brief CPI-induced turbulence, up 2.4% and 1% respectively over the past 24 hours.
However, under the surface, ETH’s implied volatility has hit multi-week lows across the board. The current term structure shows compressed pricing for all expiries, a classic sign that the market is entering a volatility contraction. Historically, these don't last long. When vol expands again, it tends to do so sharply.
Box plot of implied volatilities for various expiries (ETH)
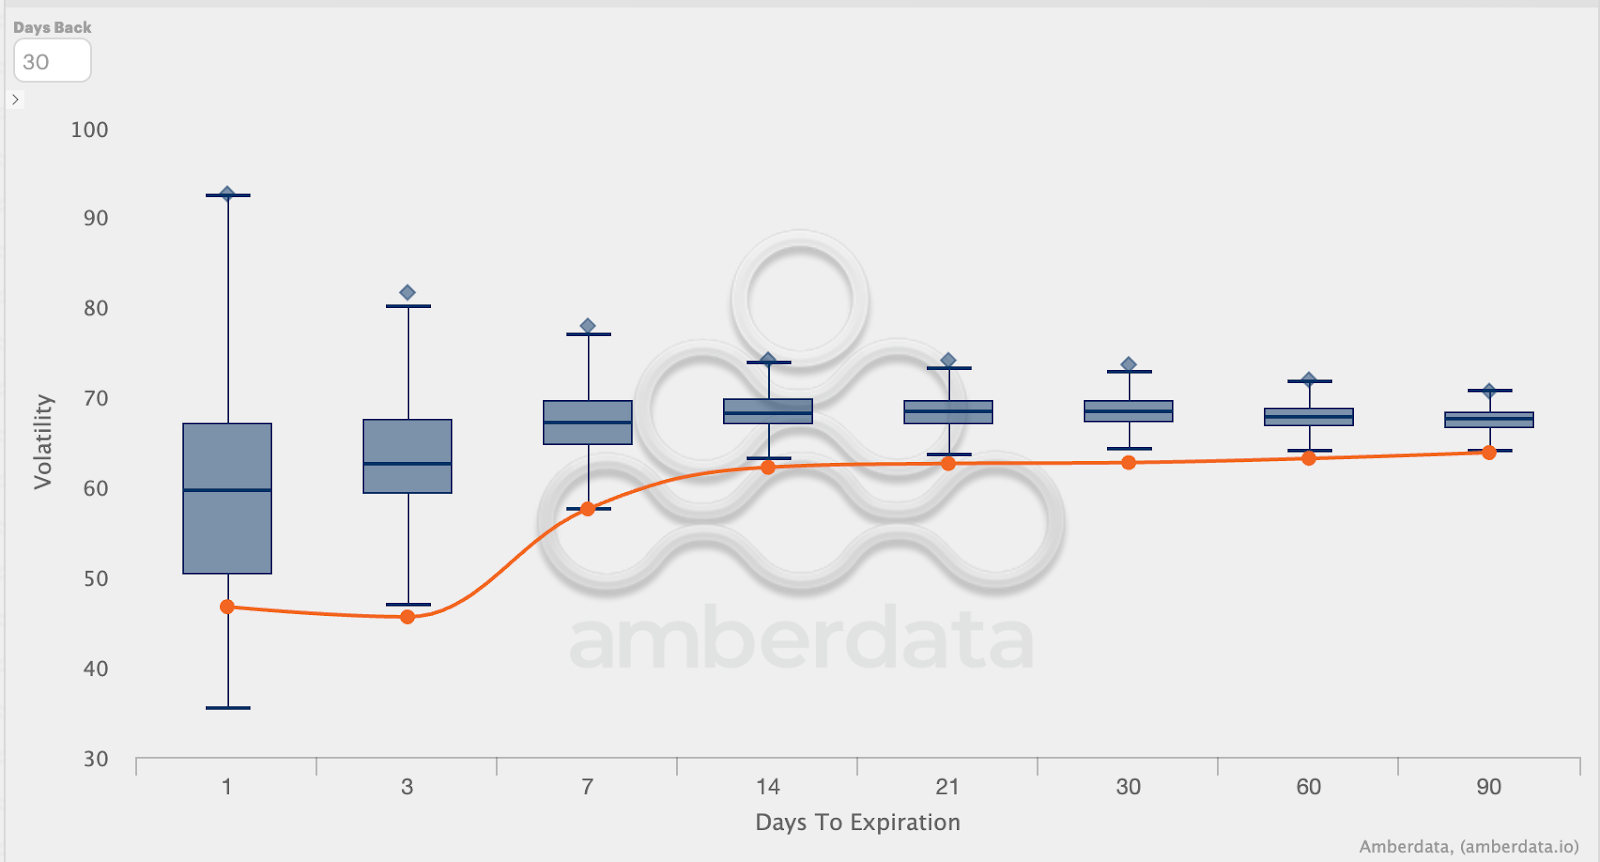
Source: Derive.xyz, Amberdata
Note: Orange line represents the current IV for these expiries
Meanwhile, ETF flows are showing a divergence. ETH inflows have slowed considerably, while BTC saw a meaningful spike in institutional buying yesterday. The smart money appears to be rotating back into BTC, possibly taking a breather from ETH beta after its recent run.
ETH ETF inflows
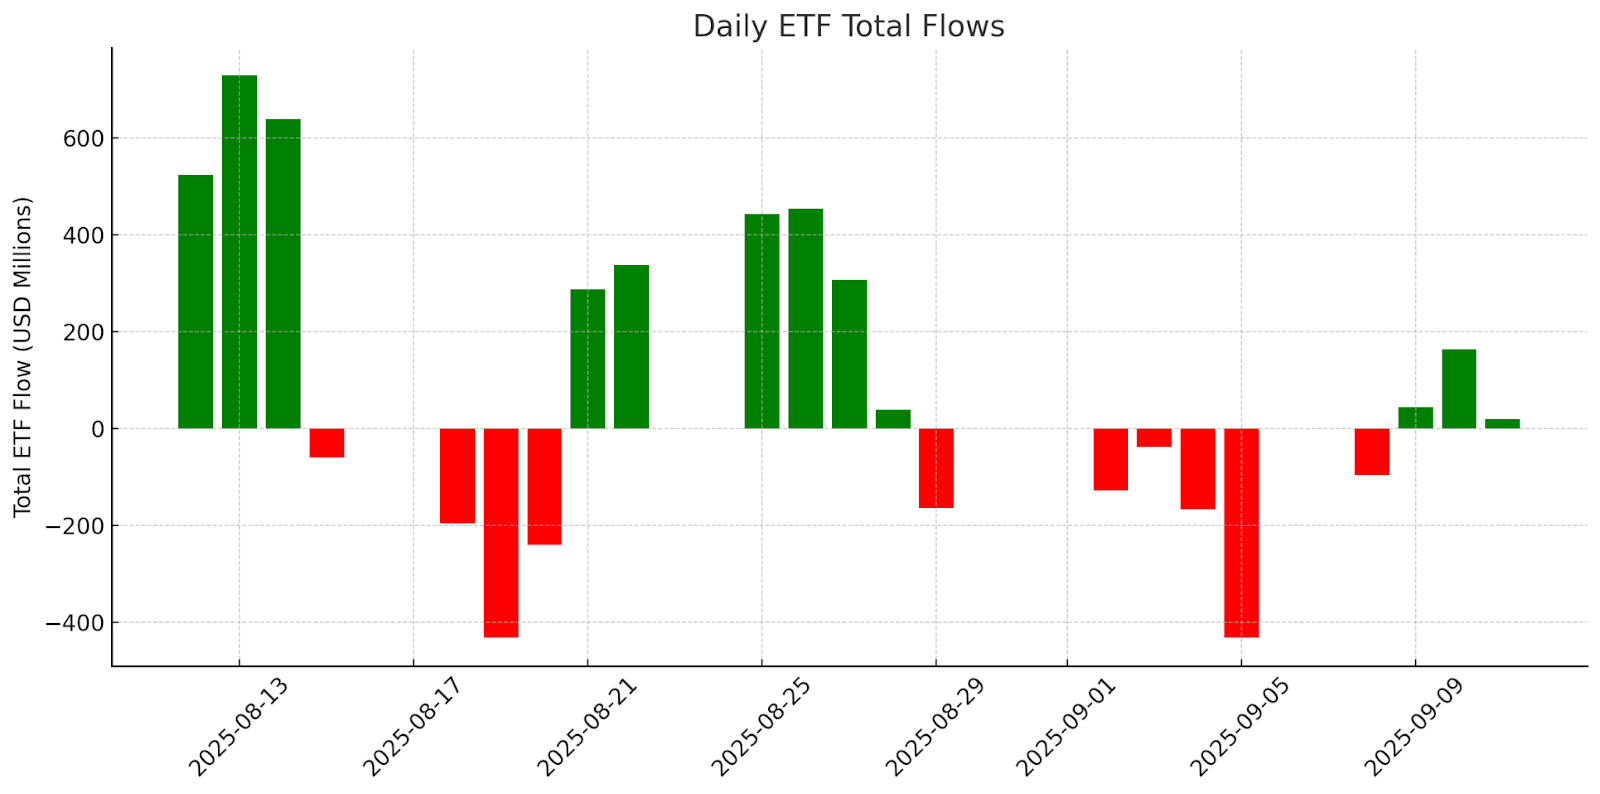
Source: https://www.strategicethreserve.xyz/
BTC ETF inflows
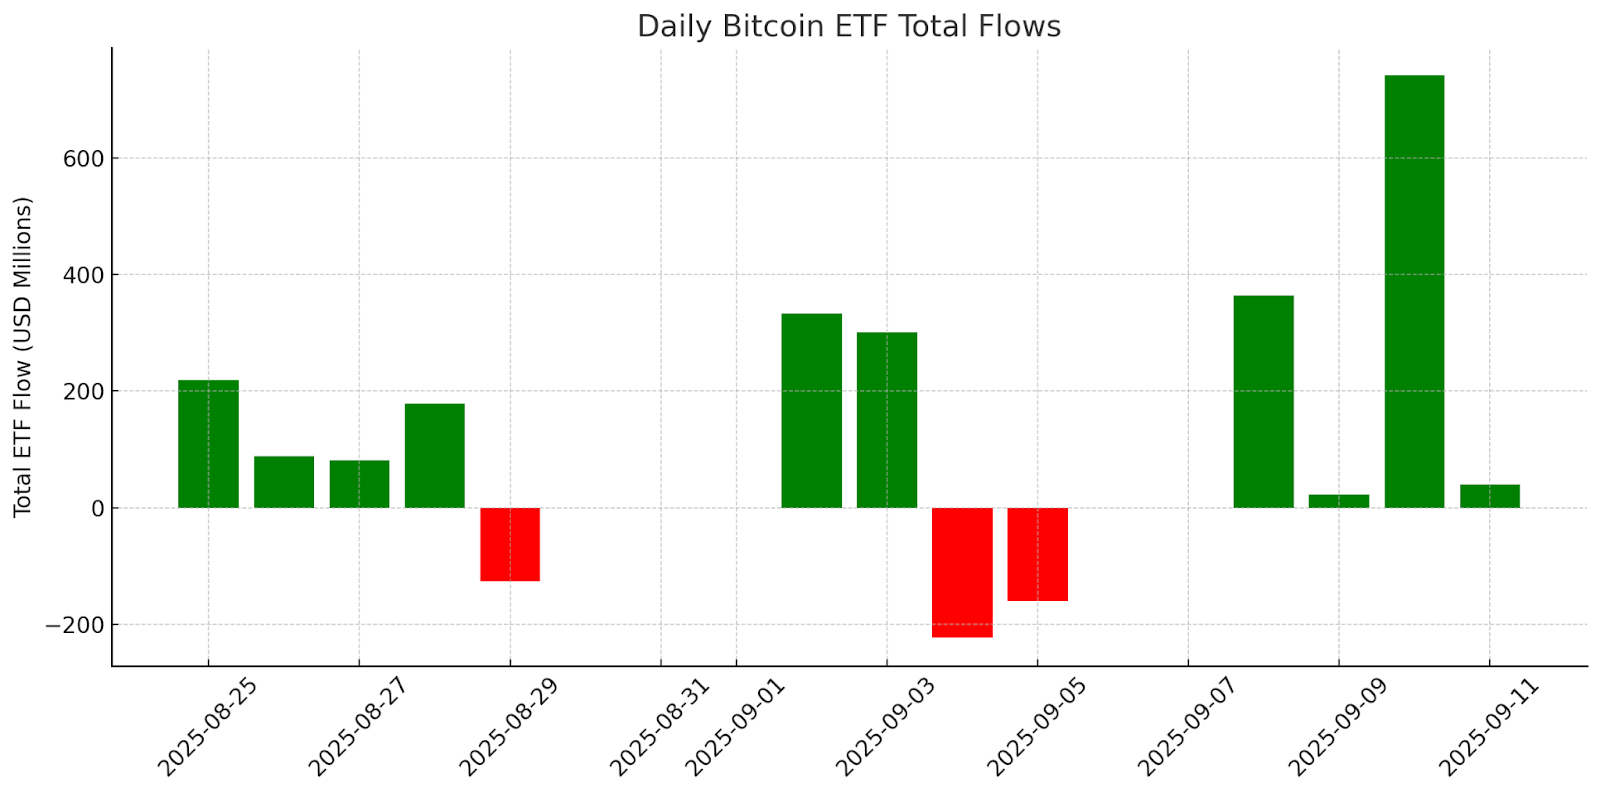
Source: https://farside.co.uk/btc/
These flows are now reflected in options pricing and market sentiment. The probability of BTC hitting $125K by the end of October has jumped from 40% to 52%. In contrast, ETH’s path to $6K looks increasingly unlikely, with odds falling from 23% to just 19%.


