



The options chain is the screen where every trade starts. It looks dense the first time you open it, but it is really just four things: when the option expires, at what price, what it costs, and how it will behave.
This guide walks through the layout on Derive, column by column.
Start With the Expiry
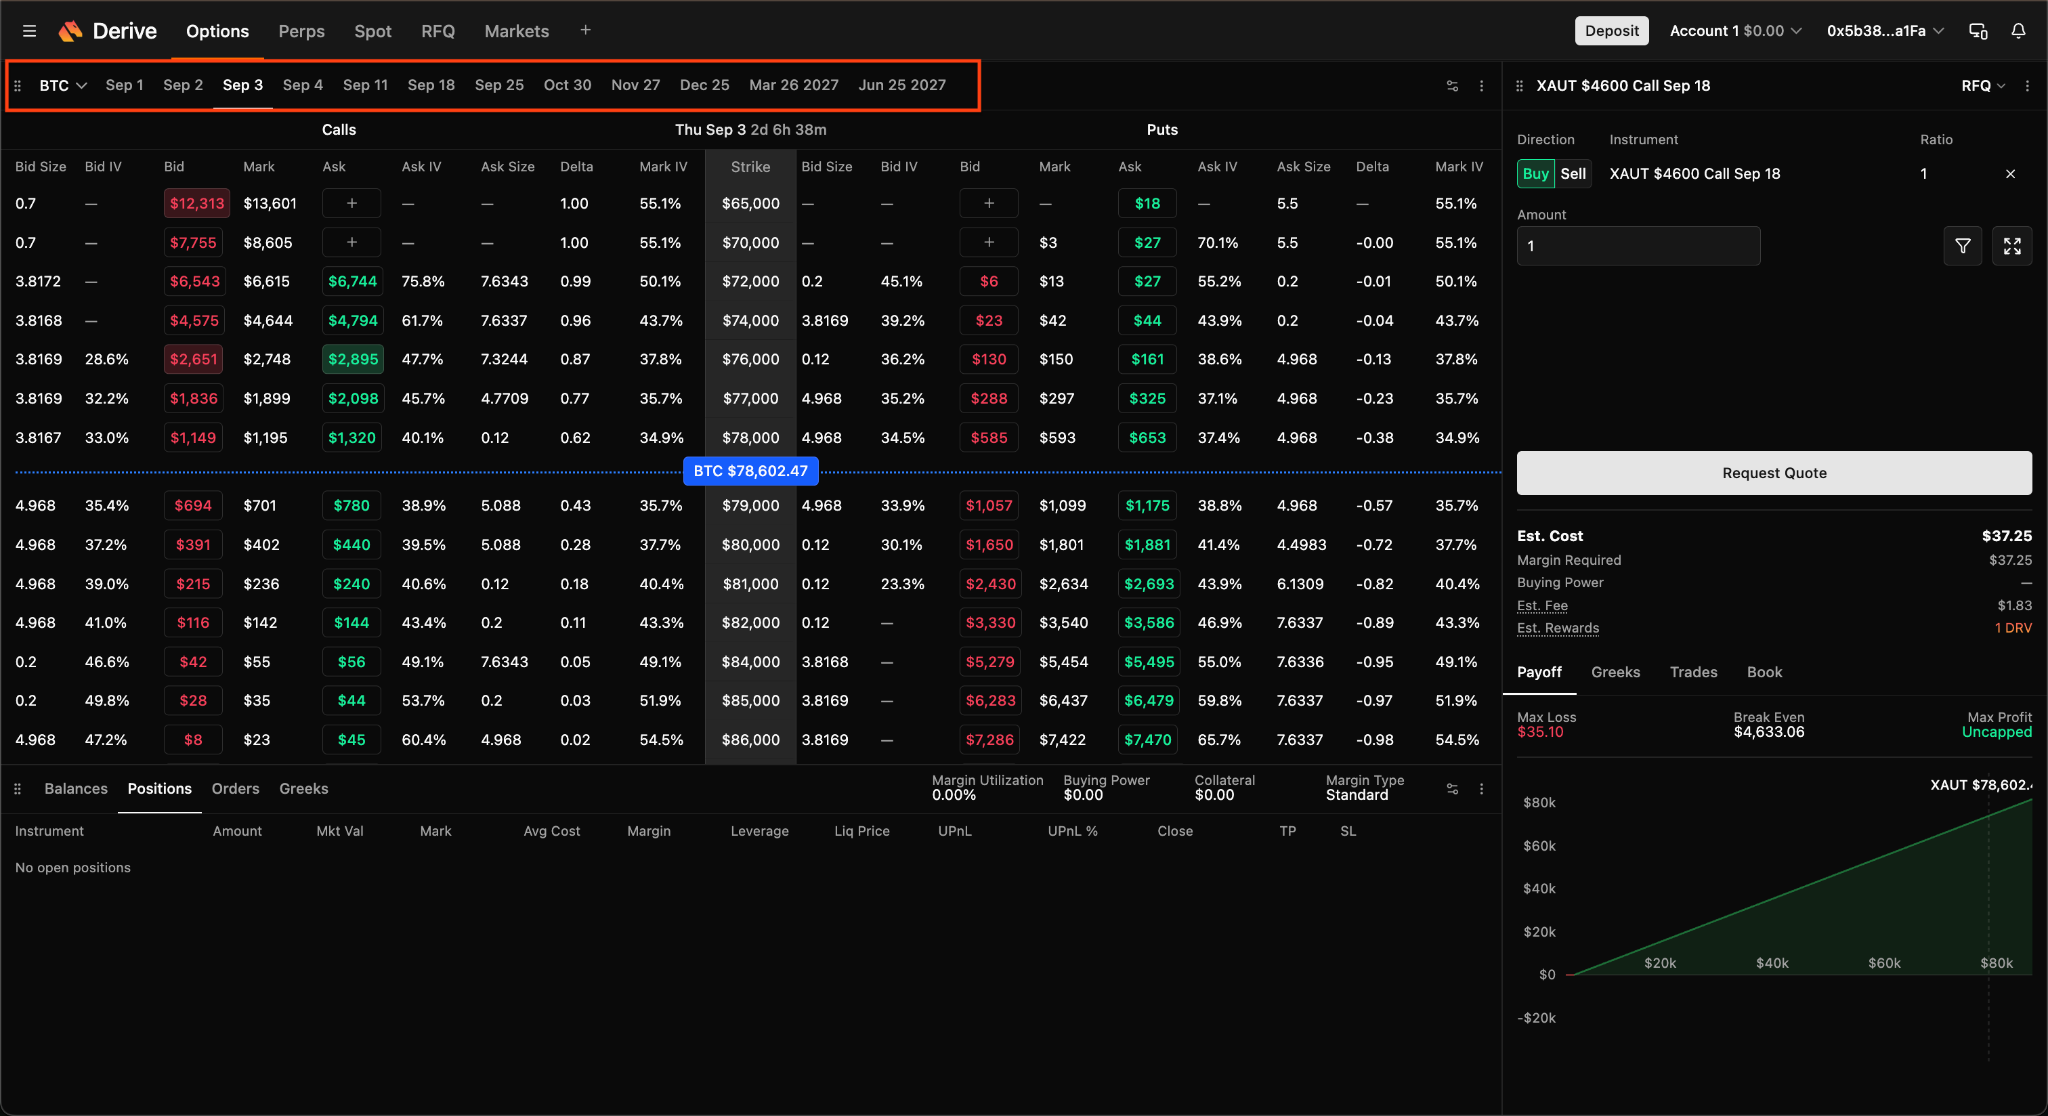
The row of dates across the top is the list of expiries. Every option on the screen below belongs to the date you select there.
Short expiries are cheaper and move faster. Longer expiries cost more and give the trade more time to work. Nothing else on the chain makes sense until you have picked one, so this is always the first click.
Calls on the Left, Puts on the Right
Strike prices run down the middle of the screen. Calls are listed to the left of them, puts to the right.
Between the two halves you will see a line marking the current spot price of the asset. Everything above that line is a strike higher than the market, everything below it is a strike lower than the market. That single line is what tells you at a glance whether a given option is betting on a move up or down.
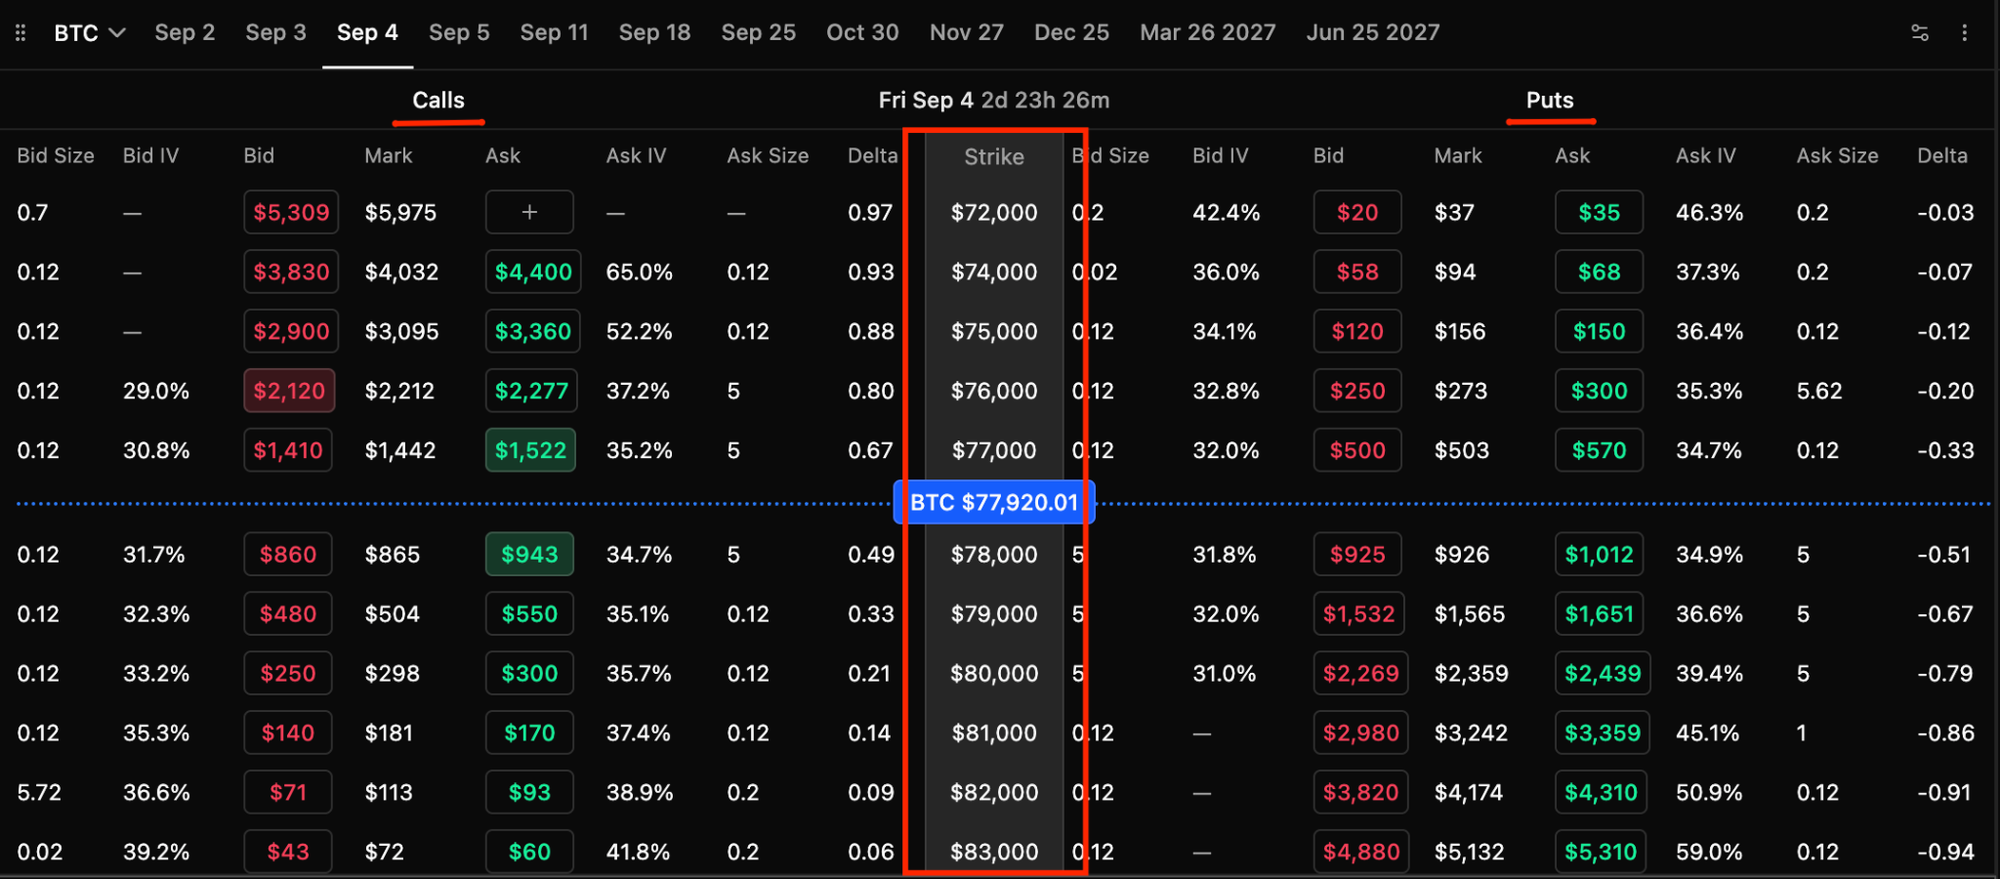
What you are looking at here is the visible orderbook. Derive also supports RFQ, request for quote, which is a separate way to get filled and a topic for a later episode.
The Three Prices in Every Row
Each row shows a bid, a mark and an ask.
- Bid is what you receive if you sell that option
- Ask is what you pay if you buy it
- Mark sits between the two and is the fair value used to price your position
Buying and selling options is usually described as paying premium and collecting premium. The premium is simply the number in the bid or ask column.
One detail that catches out almost every beginner: these prices are quoted per one full unit of the underlying. A call showing $2,200 is $2,200 for one whole BTC. You can trade fractions, so buying 0.1 contracts (equaling 0.1 BTC) costs $220.
Delta
Delta tells you how much the option moves when the underlying moves.
A call with a delta of 0.42 gains roughly $42 for every $100 BTC rises, and loses roughly $42 for every $100 it falls. Puts carry a negative delta, because they gain when the underlying falls.
Delta is not fixed. It shifts as spot moves and as expiry approaches, but as a read on how sensitive a position is right now, it is the most useful single number on the screen.
Implied Volatility
The IV column tells you how expensive an option is relative to the size of move the market expects.
Higher implied volatility means a higher premium, and that is true for both calls and puts. IV says nothing about direction. It says how much movement is being priced in, in either direction.
Putting It Together
Reading a row now takes four steps: check the expiry at the top, find the strike relative to spot, read the ask if you are buying or the bid if you are selling, and check the delta to see how the position will behave.
The next two episodes use exactly this screen to place the two simplest trades there are: buying a call and buying a put.


